
Okay, so we started this teaching series about last two, three days. We are talking about 12 technical indicators that you need to avoid on your MT4 platform while trading Forex market. So we going to continue today. We are discussing the number three technical indicators that you need to start avoiding starting today.
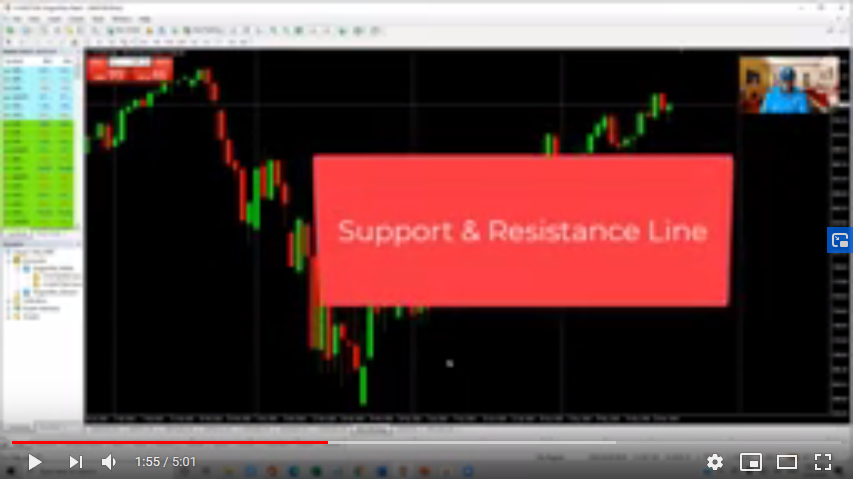
So today, one of those technical indicators that you need to start avoiding like plague on your MT4 platform today. It is ‘support and resistance line’. Yes. Support and resistance line. I’m not saying ‘support and resistance’ line or zone or the way gurus taught us are wrong. Okay, let’s see. Let me tell you something. What matters most in forex trading is the price. What the price is doing that that particular time. Not what support, nor what resistant is like. Yes, you put that into consideration when you are placing your trade. But at the same time the way so many gurus are presenting this is totally wrong.
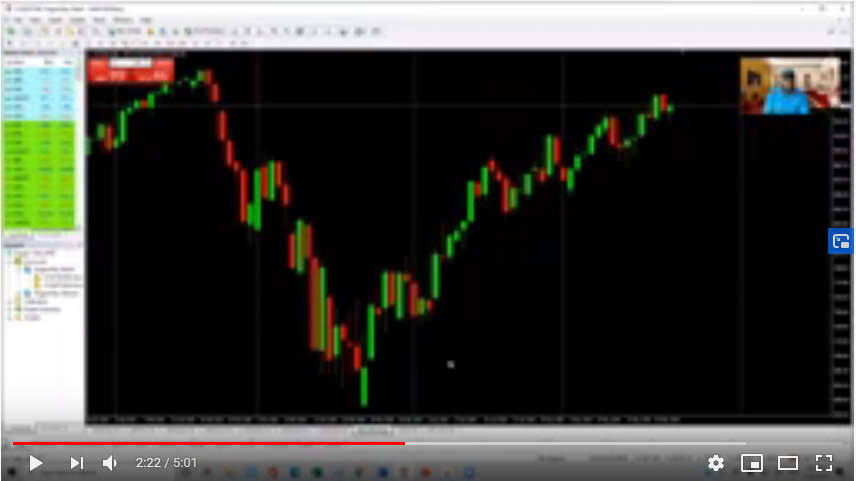
Okay, look at this chart. This is NASDAQ. Okay, so this is NASDAQ daily chart. So tell me if you are applying support and resistance line where would you have put it? When the market crashed, the market went down as low as this price. Then someone will say okaySo we said, okay, so always the support and resitance line. So, someone is going to tell me the market is going to be all right – yet. Oh look at how the market has moved since that crash.
Okay, so what if you are drawing your support-resistance line here. Okay, what if you have drawn leads over here Okay, because this is valid. What if you are drawn also over here it is also valid. Okay, let’s zoom out. What if you have thought, okay this, this could be it. Okay, so this is, this is on daily chart so let’s go to four hour chat. If you go to four hour chats you will also see many, many more.
Okay, so like so what I’m saying as things is that it depends on the charts you are looking at. If you are looking out for five minutes, you are looking out at fifteen minutes, you’re looking at one hour, the way that you withdraw yourself off that resistance line will be totally different to someone that is looking at weekly chart or monthly chat.
So you need to understand the concept and you need to learn out to trace of support and resistance line. And just know that this is not really a line, we are talking about zone. So it’s going to be in zone not just in line. I will be looking into this in details as time goes on in this series. Okay. I hope you’ve gotten the nugget once again after weekend to you. If you have not liked this video, go ahead and like this. If you do share it on your Facebook profile. I’m so spiked with this YouTube channel. I know one day we pull out the winner of our 7,500 now. So just skip to this video. So I’ll see you tomorrow as a blessed weekend.
